

The TryHackMe Splunk: Dashboards and Reports Room is a subscriber/MAX only room that shows how to create reports, alerts and dashboards with Splunk. The room is avaiable at: https://tryhackme.com/room/splunkdashboardsandreports
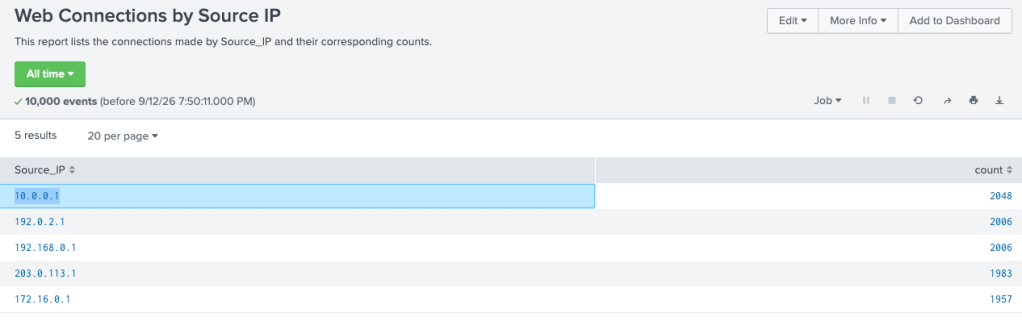
1.1 Head to the Splunk Reports tab and open the Web Connections by Source IP report.
Which Source_IP field value recorded the highest number of events?
Answer: 10.0.0.1
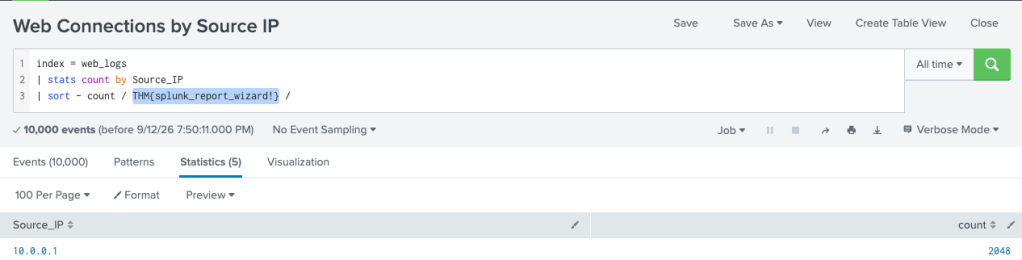
1.2 While viewing the report above, click Edit → Open in Search to investigate the query behind the report. What is the flag value hidden within the search query?
Answer: THM{splunk_report_wizard!}
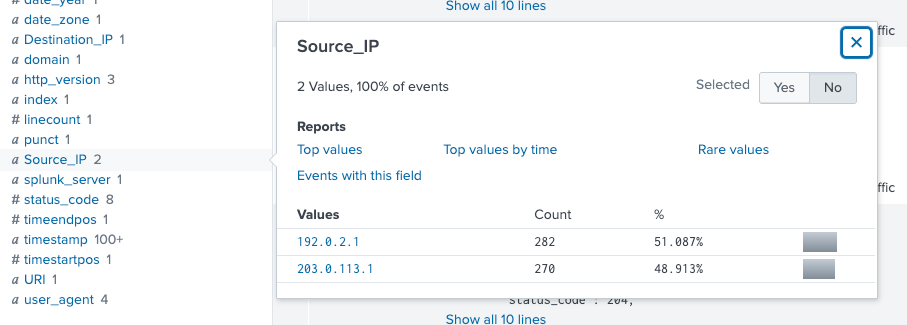
2.1 How many Source_IP addresses outside of the expected range accessed /restricted.html?
Answer: 2
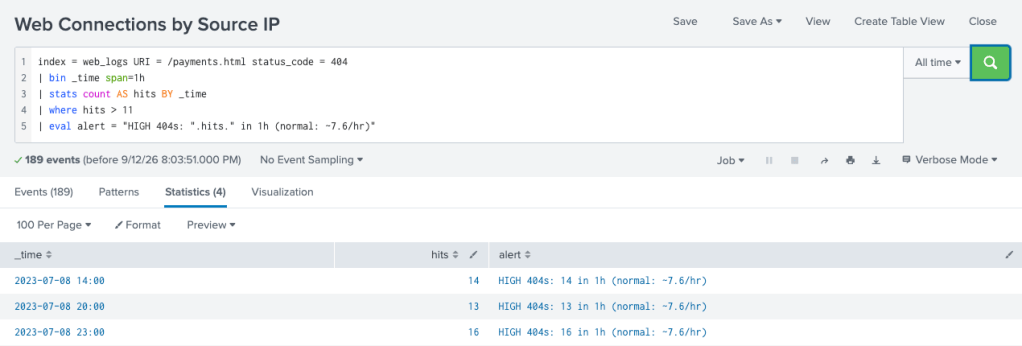
2.2 How many total 404 status_code were recorded at /payments.html?
Answer: 189

2.3 What is the highest number of 404‘s received in a given hour with the data available?
Answer: 16
3.1 Inspect the URI pie chart you built in the dashboard above. Which URI field value has the least amount of events present?
Answer: /pictures.html
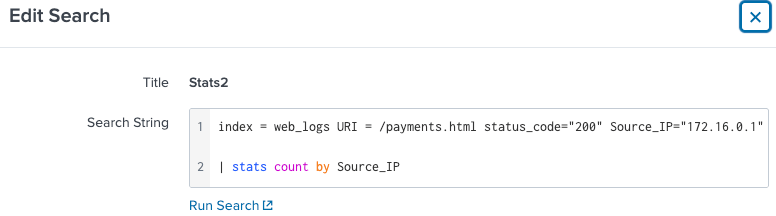
3.2 Add another statistics table to your dashboard to view the Source_IP, URI, and status_code fields. How many times did 172.16.0.1 receive the status_code 200 from /payments.html?
Answer: 50
4.1 Which feature in Splunk Enterprise Security provides visibility into SOC efficiency and performance?
Answer: SOC Operations
4.2 What does Splunk SOAR use to automate response actions based on conditions, filters, and decision logic?
Answer: Playbooks

